Unified Observability
Thinking about the future of logging, metrics, and tracing in applications.
The last decade has seen exciting developments in runtime observability of services. Log aggregation and search are a requirement for operationalizing systems. Organizations are collecting real-time metrics from production systems and using that data to get insight into customer behavior. Most importantly, distributed tracing is becoming mainstream.
Despite the increasing awareness of observability practices, there remain many barriers to adopting these technologies. Perhaps the most significant obstacle is integrating libraries/frameworks into services. For instance, it's unlikely every observability tool will have a client for your platform.

Relying directly on clients can also be a problem. Observability tools differentiate themselves from competitors by offering unique features. If you use those features, it will be hard to move off the client if your new provider does not have a similar feature set. Instead, your service could rely on a standardized abstraction. For example, OpenTelemetry offers client abstractions for Tracing and Metrics collection. Some languages, like Java, have similar abstractions for logging (SLF4J).
The biggest issue with client integrations is how intrusive the implementation can be in your domain code. Look at the example from the OpenTracing website:
// https://opentelemetry.io/docs/js/instrumentation/

function doWork(parent) {
  const span = tracer.startSpan('doWork', {
    parent, attributes: { attribute1 : 'value1' }
  });
  for (let i = 0; i <= Math.floor(Math.random() * 40000000); i += 1) {
    // empty
  }
  span.setAttribute('attribute2', 'value2');
  span.end();
}
Of course, there are ways to abstract some of these "crosscutting concerns," but that assumes the framework in which you write code is flexible enough to be modified to perform some of this work. For instance, we implemented an "auto span" plugin for Knex.js to transparently record database calls in OpenTracing (Jaeger backend). However, implementing the plugin required a service library with an explicit extension point (something you will not get out of the box with many HTTP frameworks).
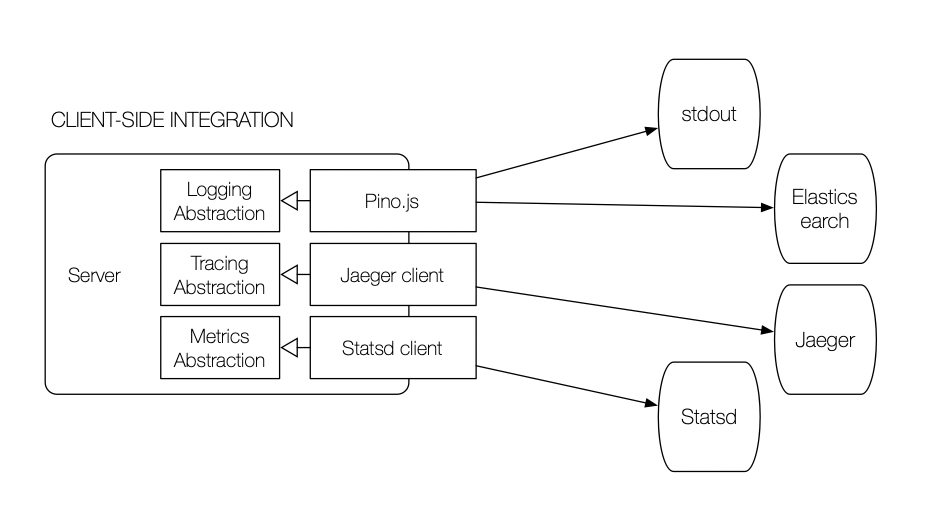
So far, I have spoken mainly about the "client-side" integration pattern for observability tools, which looks something like this:

Most architectures don't use pure client integration anymore. Aggregating data from the client directly to the backing store doesn't make sense with thousands of processes in your infrastructure. Client-side aggregation suffers typical operational challenges:
- Configuration management (including refreshing for running services)
- Service discovery (where is the observability endpoint?)
- Reliability (throttling, circuit breaking, retries, etc.)
- Security (should the service be communicating to the endpoint?)
Client-side integration also has the downside of placing a lot of the logic (and therefore processing burden) on the local process. So not only is the service coordinating actions for its clients, but it's also managing connections to Statsd, serving Prometheus metrics requests, formatting logs, etc.
Standardizing on Daemons/Sidecars
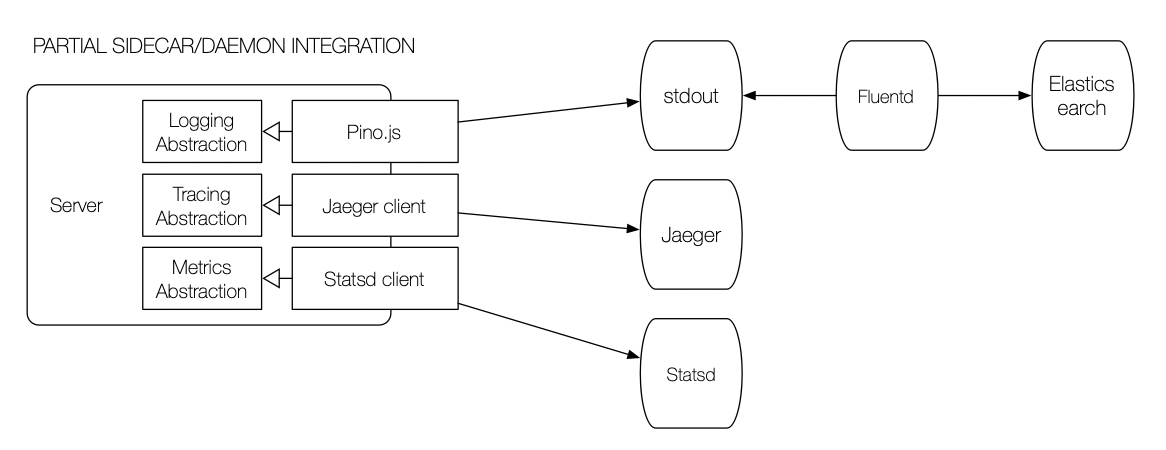
The general solution to client-side integration problems is to move the processing to a more centralized service. The industry has developed two standard deployment patterns to support this use case: daemons and sidecars:

A daemon is an external service that provides functionality to a traditional business application. In this case, the daemon (Fluentd) parsing and aggregating logs. Daemons deploy as single-instance services on a host (bare-metal or VM). Fluentd, a log aggregator, will consume all the stdout and stderr streams in Docker and forward the entries to one or more external endpoints.
Sidecars deploy with an application (think "sidecar" on a motorcycle) and only serve that peer application. A typical use case for sidecars is to provide secrets and configurations specific to its peer service.
The daemon and sidecar patterns are more effective when providing multiple services (e.g., logging, metrics, tracing). However, until recently, few open-source frameworks offered multiple observability modes. The first multi-service daemons were commercial offerings like Datadog:

Datadog's integration, however, is far from perfect. Services are still required to use multiple strategies/protocols to aggregate data to the daemon. For instance, Datadog will collect logs from stdout but still requires services to use the Statsd protocol for metrics and the OpenTelemetry library for traces. What makes the integration more painful is that none of these tools integrate out-of-the-box. Developers have to propagate IDs between logs and traces to correlate them in the dashboard.
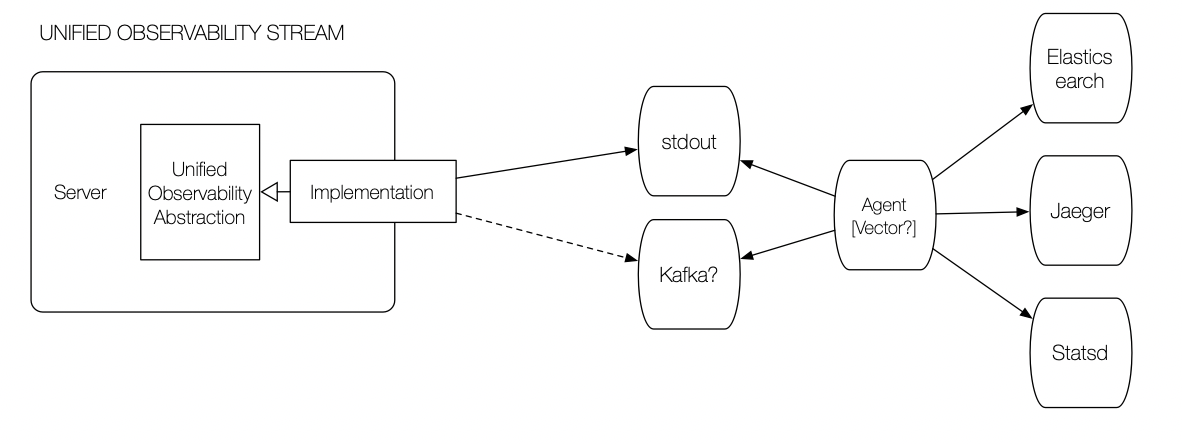
I generally think the daemon pattern (and not the sidecar) is the best pattern for providing observability into services. I also think having the daemon own the entire process is the ideal approach for integrating services. The only thing missing is a unified mechanism for delivering logs, metrics, and traces to the daemon.

The key to the unified integration pattern is that the service, for the most part, is unaware of it. Instead, services publish a standardized event to an "observability stream." The event can be a log, trace, or metric. More likely, the event is all three; it blurs the distinction which better models reality and not the separation of tools.
Aggregation is a result of a daemon monitoring the observability stream. The daemon would interpret events, transforming them if needed, and forward them to the correct backing store. More importantly, if backing stores can perform cross-tool correlation, the daemon has the context necessary to provide the correlating identifiers.

If the standard way of producing observability events is stdout (the console), virtually any system could integrate with the aggregation system. Using stdout could be a problem in systems with large capacity hosts and a high density of services. An alternative approach might be using Kafka as the event stream.
Either way, a stream of observability events has the advantage of allowing multiple providers to listen to a stream. I would discourage having a daemon for each observability mode (logging, metrics, tracing). However, using different daemons as means of testing or transitioning between providers would be a powerful paradigm. Imagine being able to launch an AWS daemon alongside your Datadog agent so you could explore the newest features of CloudWatch or XRay. If you were using a persistent stream, you could even migrate old data into the new system with little effort.
Standard Observability Event
Our ability to get to a unified observability stream would require the industry to standardize on an event schema. I think now, more than ever, we may have the impetus in the industry to reach this goal. OpenTelemetry and CloudEvents are great examples of organizations coming together under a standard. CloudEvents would probably be the envelope schema used by a Unified Observability Event.
So what would the developer experience be like with unified observability events?
The best solution would look like logging:
log.info('Request received to update user profile.')
Admittedly, this is not a very impressive example. However, when combined with context from the request:
export default [
  // Of course, this should be registered at the app level,
  // unless there are request-specific metadata to add.
  observe.startContext({
    component: 'UpdateUserProfile',
    tags: {
      add: {
        foo: 'bar',
      },
      fromEnv: ['CLUSTER', 'NODE_ENV'],
    },
  }),
  (req, res, next) => {
    req.log.info('Request received to update user profile.')
    // ...
  }
]
The log.info would emit to stdout an event that looked something like this:
{
    "specversion" : "1.0",
    "type" : "org.cncf.observable/msg",
    "source" : "com.myco/users",
    "subject": null,
    "id" : "34dc3d61-6c71-4694-9c59-f354d327dce7",
    "time" : "2021-03-21T04:02:21.331Z",
    "datacontenttype" : "application/json",
    "data" : {
        "id": "34dc3d61-6c71-4694-9c59-f354d327dce7",
        "time" : "2021-03-21T04:02:21.331Z",
        "level": 30,
        "component": "UpdateUserProfile",
        "message": "Request received to update user profile.",
        "tags": {
          "foo": "bar",
          "CLUSTER": "staging",
          "NODE_ENV": "staging"
        },
        "metadata": {
          "sessionId": "121jkhuaiuuhaiusdh13989hasjkdfh1",
          "params": {
            "userId": 123,
          },
          "client": {
            "agent": "Mozilla/5.0 (Macintosh; Intel Mac OS X...",
            "ip": "127.0.0.1"
          }
        }
    }
}
This is pretty-printed -- it would be one object per line.
Observability contexts originate using the common "child" convention. Child contexts inherit metadata from the parent and can override/extend those properties with additional tags. Child contexts are also a natural place to begin and end tracing spans automatically:
async function getUserProfile(
  logger: Log,
  userId: number,
): Promise<Profile | null> {

   const log = logger.child({
     component: 'getUserProfile',
     userId,
   })

   log.debug('Looking up user profile.')

   const profile = await repo.getProfile(userId)

   log.debug(
     { profileFound: !!profile },
     'Returning profile to caller.'
   )

   // It would be nicer to auto close this!
   log.finish()

   return profile
}

// ...
(req, res, next) => {
   // ...
   const profile = await getUserProfile(
     req.log,
     req.params.userId,
   )
   // ...
}
The code above might produce the following events:
[
  {
      "specversion" : "1.0",
      "type" : "org.cncf.observable/msg",
      "source" : "com.myco/users",
      "subject": null,
      "id" : "34dc3d61-6c71-4694-9c59-f354d327dce7:d1f358c60c4e:1",
      "time" : "2021-03-21T04:02:21.012Z",
      "datacontenttype" : "application/json",
      "data" : {
          "level": 20,
          "component": "getUserProfile",
          "message": "Looking up user profile.",
          // ...metadata and tags
       }
  },
  {
      "specversion" : "1.0",
      "type" : "org.cncf.observable/msg",
      "source" : "com.myco/users",
      "subject": null,
      "id" : "34dc3d61-6c71-4694-9c59-f354d327dce7",
      "time" : "2021-03-21T04:02:21.212Z",
      "datacontenttype" : "application/json",
      "data" : {
          "level": 20,
          "component": "getUserProfile",
          "message": "Returning profile to caller."
          // ...metadata and tags
      }
  },
  {
      "specversion" : "1.0",
      "type" : "org.cncf.observable/ctx-end",
      "source" : "com.myco/users",
      "subject": null,
      "id" : "34dc3d61-6c71-4694-9c59-f354d327dce7:d1f358c60c4e:3",
      "time" : "2021-03-21T04:02:21.323Z",
      "datacontenttype" : "application/json",
      "data" : {
          // ...metadata and tags
      }
  }
]
The example events use a hierarchical ID to represent the context chain. The original ID (a UUID) originated from the request middleware. The last event's message type signifies the end of a context; this would be used by tracing systems to mark the end of a span.
Conclusion
While observability tools (logging, metrics, tracing) continue to evolve, the developer experience and infrastructure continue to lag behind vendor solutions. I believe the industry could make some minor changes towards a unified standard for emitting "observability events" that would be easier (and cleaner) to integrate into services and decouple aggregation infrastructure and vendor solutions. This approach would benefit all parties by minimizing the complexity of using these tools and democratizing the interfaces so vendors and open-source providers could compete on a level playing field.
Stumbling my way through the great wastelands of enterprise software development.
